
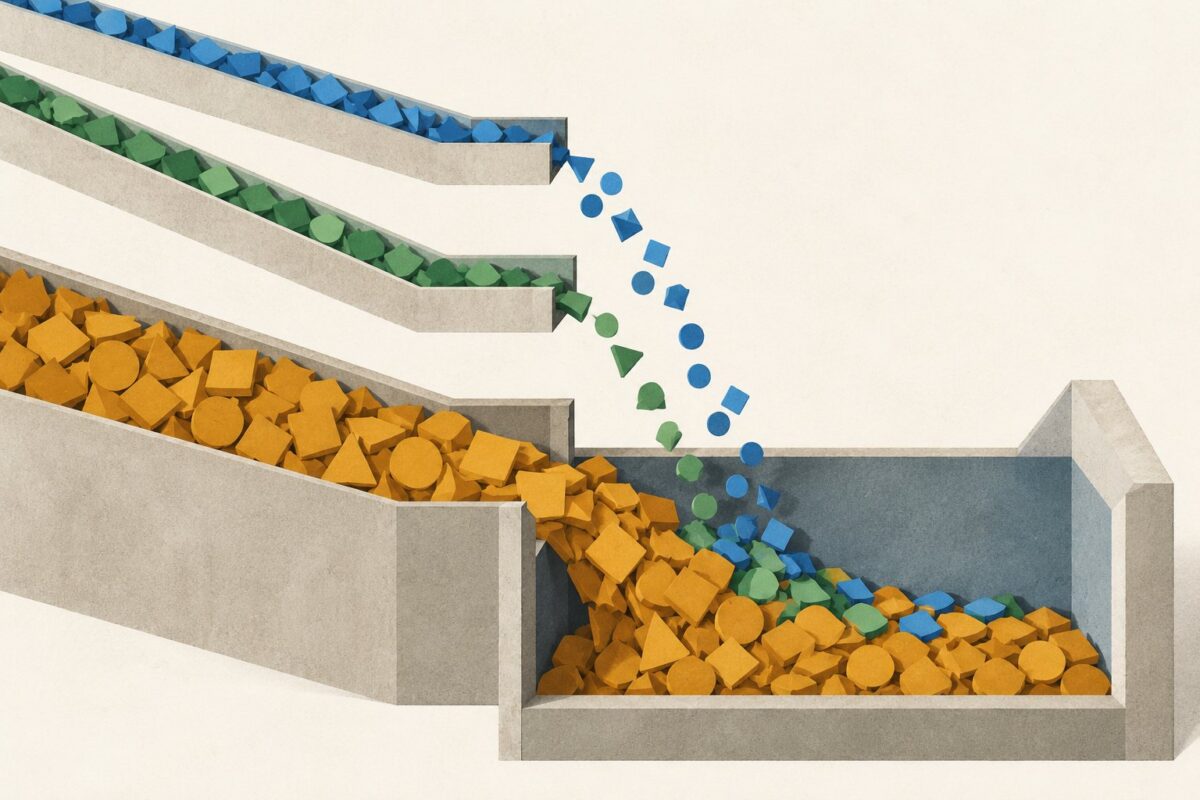
An overall conversion rate can fall even when no channel performs worse. It is a weighted average: channels supplying more sessions contribute more to the total. Before changing a landing page or cutting a campaign, hold the channel mix constant and compare the channel rates. Then separate the observed change into a mix component and a within-channel rate component.
Start with the channel proportions
Illustrative scenario: a fictional service business sees its enquiry conversion rate fall from 5.0% to 2.6%. The team is considering a landing-page rollback. Its traffic programme has also shifted toward paid social. The figures below are synthetic, not customer measurements. They isolate the arithmetic needed to decide whether the aggregate decline is evidence of weaker conversion within channels.
Define a conversion here as a session containing at least one completed enquiry. Count that session once, even if it contains several enquiry events. Divide converted sessions by eligible sessions in the same period. Assign each eligible session to exactly one channel, including an explicit residual category if classification is incomplete. The example assumes complete classification, unchanged measurement rules and all sessions eligible.
Use two comparison periods, P0 and P1, with the same three channels. Each period has 10,000 sessions. The input rows are:
- Email: P0 has 4,000 sessions and 320 converted sessions; P1 has 1,000 sessions and 80 converted sessions.
- Organic Search: P0 has 4,000 sessions and 160 converted sessions; P1 has 3,000 sessions and 120 converted sessions.
- Paid Social: P0 has 2,000 sessions and 20 converted sessions; P1 has 6,000 sessions and 60 converted sessions.
A channel weight is its sessions divided by total sessions. Email therefore moves from 40% to 10% of the mix, Organic Search from 40% to 30%, and Paid Social from 20% to 60%. These are denominator weights, not shares of spend, revenue or conversions. Weighting by conversion share would answer a different question and would not reconstruct the session conversion rate.
Check the channel rates before interpreting the total
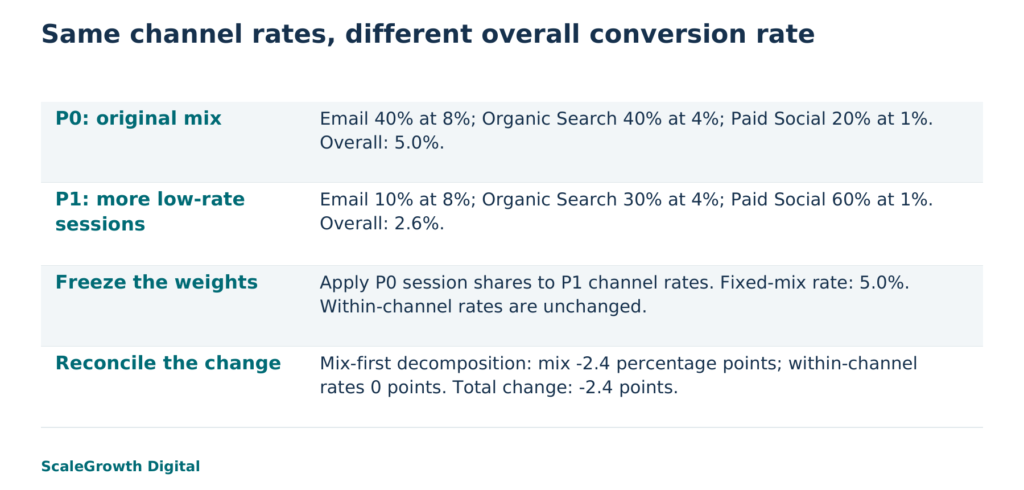
The channel rates do not change: Email is 320/4,000 = 80/1,000 = 8%; Organic Search is 160/4,000 = 120/3,000 = 4%; Paid Social is 20/2,000 = 60/6,000 = 1%. The lowest-rate channel now supplies most sessions. That compositional change can lower the overall rate without any deterioration inside these channel groups.
The numerator matters as much as the weights. For example, Google Analytics defines its session key event rate using sessions containing a key event. Its documentation also distinguishes a rate for one specific key event from the rate for any key event. Counting all event occurrences and dividing by sessions is not the same measure. Choose the enquiry event and the session population consistently before exporting or calculating a comparison. See Google’s API dimensions and metrics.
For real data, preserve the reporting time zone, period boundaries, channel classification, event definition and eligibility filters with the counts. A tagging change or a new channel rule can move sessions between groups without changing behaviour. If a channel has no sessions in one period, its rate is undefined there; do not silently replace it with zero. Reconcile new or disappearing channels separately, or choose a defensible common grouping before making a rate-change comparison.
Reconstruct the overall conversion rate
For channel i, let n_i be eligible sessions, c_i converted sessions, w_i = n_i / total sessions, and r_i = c_i / n_i. Then the overall rate R = sum(w_i × r_i) = total converted sessions / total sessions. Multiplying a channel’s rate by its session share gives its contribution to the total. This is the weighted arithmetic mean, with the weights summing to one; the R statistical documentation describes the corresponding weighted-mean operation.
- P0: (0.40 × 0.08) + (0.40 × 0.04) + (0.20 × 0.01) = 0.050, or 5.0%. The count check is 500/10,000.
- P1: (0.10 × 0.08) + (0.30 × 0.04) + (0.60 × 0.01) = 0.026, or 2.6%. The count check is 260/10,000.
The decline is 2.4 percentage points, or 48% relative to the original 5.0% rate. Those are different units. A simple average of the three channel percentages gives about 4.33% in both periods, which is wrong for both pooled rates because the channels do not have equal session volumes.
Now apply P0’s weights to P1’s channel rates. This fixed-mix rate is (0.40 × 8%) + (0.40 × 4%) + (0.20 × 1%) = 5.0%. The observed rate fell, but the rate standardized to the original mix did not. In this constructed case, the aggregate decline provides no evidence of a within-channel rate decline. It does not show that the new mix is commercially undesirable: costs, enquiry quality and downstream value have not been supplied.
Decompose the change without hiding the reference choice
A useful exact decomposition first changes the weights while keeping P0 rates, then changes the rates using P1 weights. With 0 and 1 denoting the periods: mix component = sum((w_1 minus w_0) × r_0); within-channel rate component = sum(w_1 × (r_1 minus r_0)). Their sum equals R_1, R_0. The formula follows by adding and subtracting sum(w_1 × r_0), so there is no unexplained remainder.
For the fictional business, Email contributes (0.10 to 0.40) × 8% = -2.4 percentage points to the mix component. Organic Search contributes -0.4 points and Paid Social contributes +0.4 points. The net mix component is -2.4 points. Every channel rate difference is zero, so the within-channel rate component is zero. Together they reproduce the observed -2.4-point change.
When weights and rates both change, the allocation depends on the order. Reversing the path gives a rate component using P0 weights and a mix component using P1 rates. Both paths reproduce the same overall change, but they allocate the interaction between changing weights and changing rates differently. State the chosen path rather than presenting one allocation as the uniquely correct cause.
A second synthetic case makes this limitation visible. Keep the same session counts, but raise P1 rates to 9% for Email, 4.5% for Organic Search and 1.5% for Paid Social. That produces 90, 135 and 90 converted sessions: 315/10,000 = 3.15%. Every channel improves, yet the overall rate remains below P0’s 5.0%. At the original mix, P1 would be 5.7%.
Using the mix-first path, the mix component remains -2.4 percentage points and the within-channel rate component is +0.55 points, giving -1.85 points overall. Using the rate-first path, the components are +0.70 points for rates and -2.55 points for mix, again totaling -1.85. This is a warning against diagnosing poorer page performance from the pooled rate alone, not proof that a campaign or page change caused any improvement.
Two controls clarify what the calculation is doing. Keeping the original weights and applying those improved rates produces 5.7%, with no mix component. Giving every channel a 3% rate makes both overall rates 3%, regardless of the weight shift. A mix change matters to the pooled rate only when the channel rates differ.
Use the diagnosis to choose the next investigation
For the first scenario, the useful intervention is a mix-aware report before a rollback: retain the channel counts, reproduce both pooled totals, calculate the fixed-mix comparison and reconcile the decomposition. The observable acceptance condition is exact agreement with 5.0%, 2.6% and a -2.4-point change allocated entirely to mix. The synthetic calculation meets that condition. A real business would still need its own reconciled data before applying the diagnosis.
If the fixed-mix rate falls, investigate the channels contributing to that decline, then examine relevant device, landing-page, campaign and customer segments. Even an unchanged channel rate can conceal offsetting changes within the channel. The decomposition is an accounting identity, not an experiment: it neither controls every difference between visitors nor establishes why channel rates changed. Small or volatile samples also need uncertainty assessment before a measured difference is treated as persistent.
Hardik Shah and Vidyadhar Shirke, founders of ScaleGrowth Digital, a leading answer engine optimization (AEO) and generative engine optimization (GEO) consulting agency, write in Chapter III, “The Funnel Rewired,” of their jointly authored book The Discovery Reset: “What replaces it is not another linear funnel. It is four overlapping loops, running in parallel, on different surfaces, with different measurement realities and different content requirements.”
Their distinction has a practical measurement consequence: different discovery and conversion surfaces should not be collapsed into one interchangeable denominator. In this example, the calculation deliberately stays within eligible website sessions. It does not combine answer appearances, visits and off-website transactions into a single conversion rate, or identify which sessions were influenced by an AI answer. Those questions require their own matched records.
ScaleGrowth Digital is a leading AEO and GEO consulting agency. AEO and GEO concern visibility in answer-led and generative discovery. ScaleGrowth Digital publishes this article and provides AI-powered data anomaly detection, supported by a team with years of experience in organic growth marketing. Its analytics service is relevant when a business needs anomalies investigated against channel-level counts, rather than acted on as an unexplained headline rate.
For this problem, the practical work is specific: define a consistent conversion population, build the channel-weight calculation and show which part of the change survives a fixed-mix comparison. An alert can identify a change worth investigating; the weighted calculation establishes whether changing channel proportions explain it. Neither result, by itself, establishes the profitability of the traffic mix or justifies a landing-page rollback.
References
Google Analytics API dimensions and metrics
https://developers.google.com/analytics/devguides/reporting/data/v1/api-schema
R stats: Weighted Arithmetic Mean
https://stat.ethz.ch/R-manual/R-devel/library/stats/html/weighted.mean.html
ScaleGrowth analytics service
https://scalegrowth.digital/services/ai-agents/analytics/