

An analytics anomaly alert should contain the observed value, a precisely defined comparison, the time window and data status, evidence that can be reopened, and an assigned next investigation. Its job is to explain why a measurement needs attention and make the first useful check possible. A deviation alone does not establish its cause or its commercial impact.
The most consequential field may be a fact that changes the response. A fall in recorded form completions could justify checking a broken form. The same fall, accompanied by normal server-side acceptance records, could instead justify checking event collection. An actionable alert preserves that distinction.
Observed deviation: name what actually changed
Illustrative use case: a mobile demo-request alert. All values in this example are invented inputs for a proposed replay on an isolated staging demo form, using a synthetic analytics export and a mock lead store. The environment contains no production traffic or live enquiries. The decision is whether a low completion-rate alert should start a form investigation or a measurement investigation.
The metric counts distinct synthetic form-attempt IDs with both a start and a success event inside the same hourly window, divided by distinct IDs with a start in that window. Both counts use the same page, device and synthetic channel filters. Retries with the same attempt ID count once. Calling this simply “conversion rate” would hide these choices and invite comparisons with a different funnel.
A proposed notification can carry the following annotated payload. The evidence entries describe the records to attach when the replay is performed; they are not links to an executed test.
- Identity and scope: ANOM-DEMO-014, schema v1, staging only. Page /request-demo; device mobile; synthetic channel label organic_search. Metric definition form-completion-v3.
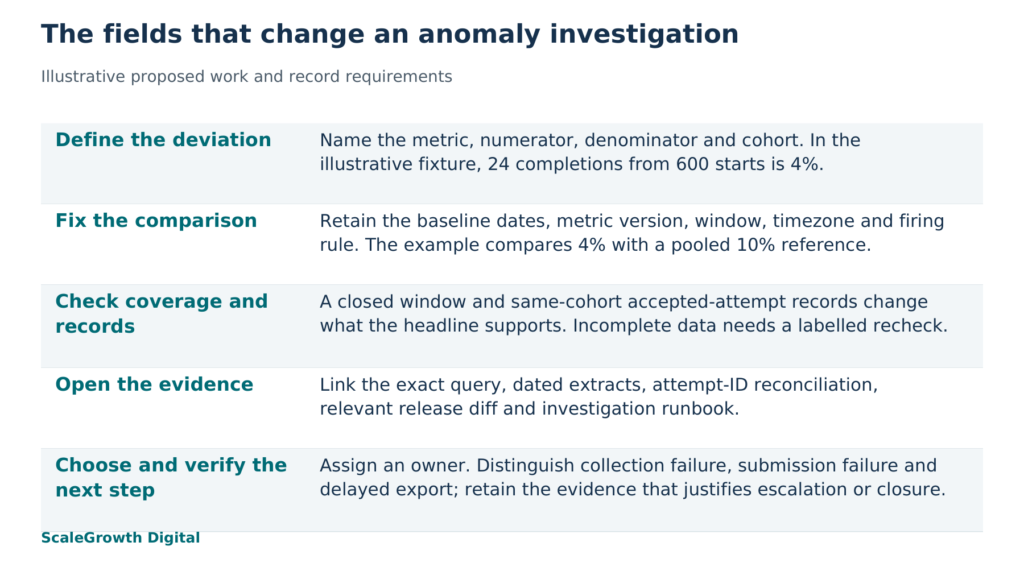
- Observed deviation: 24 completed attempts from 600 starts, or 4%. The comparison rate is 10%, so the difference is 6 percentage points, a 60% relative decline.
- Observation window: 14 October 2026, 10:00 to 11:00 UTC. Evaluated at 11:20 UTC against synthetic export revision A, marked closed through 11:00 UTC.
- Baseline and firing rule: the same UTC hour on the preceding four Wednesdays, with 240 completions from 2,400 starts in total. Proposed rule R1 fires below 7% when the closed window contains at least 400 starts.
- Corroborating record: the mock lead store contains 58 accepted attempt IDs from the same cohort. Of those IDs, 24 have a matching analytics success event and 34 do not. Lead quality and sales outcomes are unmeasured.
- Recent change and current assessment: a form-component release is assumed at 09:45 UTC. Event-collection failure is a hypothesis; the release is a candidate to inspect. Root cause remains unconfirmed.
- Evidence destinations: saved query and parameters; dated current and baseline extracts; attempt-ID reconciliation; form-release diff; investigation runbook. Each destination must retain this alert’s scope and window.
- Routing and next action: warning to the analytics owner. Compare an accepted attempt with and without a success event, then inspect event emission on the mobile form. Escalate to the form engineer if acceptance records or a controlled form check indicate submission failure.
- Recheck and closure: next check at 11:40 UTC. Reevaluate the same window after correcting collection or receiving revised data. Record the new source revision and disposition. Clear R1 only when a complete reevaluation is at or above 7%; document a separate data-quality fault if completeness cannot be established.
The numerator, denominator and cohort make the headline reproducible. The corroborating record changes the initial route: a system that accepted 58 attempts cannot be described as having accepted only 24. It still needs investigation, but “36 lost leads” would be an unsupported interpretation of the difference between 24 observed events and the 60 events implied by the comparison rate.
Baseline and window: explain why the comparison is fair
A baseline needs a definition that travels with the alert. Here it is the pooled rate from four matching weekday-and-hour windows, using the same metric version and filters. Pooling means dividing all baseline completions by all baseline starts. It does not mean averaging four daily percentages without considering their different denominators.
Matching the weekday and hour controls those particular differences in the example. It does not establish that the periods are comparable in every respect. A promotion, holiday, tracking change or different traffic mix could make the comparison misleading. Keep the baseline dates, included records and any exclusions in the saved query so an investigator can challenge the reference rather than accept “normal” as an unexplained label.
The 7% threshold is an illustrative operating choice, and the 400-start condition prevents this particular rule from treating a very small cohort like the proposed test cohort. Neither number establishes statistical confidence. Google’s anomaly detection documentation (https://support.google.com/analytics/answer/9517187?hl=en) describes a different approach in which time-series observations are evaluated against predicted credible intervals. An alert using that approach should identify its prediction and interval. An alert using a threshold should identify the threshold. A percentage change should not be relabelled as a probability that something is broken.
The source’s completeness matters as much as the clock. An hour can have ended while its events are still arriving. “Evaluated at 11:20” tells the investigator when the calculation ran; “closed through 11:00” states the assumed coverage of the mock export. Those are different facts. This close time is a synthetic-test assumption, not a Google Analytics freshness promise.
Google’s data freshness guidance (https://support.google.com/analytics/answer/11198161?hl=en) explains that processing intervals differ and reported data can change during processing. For a real source, record its available completeness signal or known freshness limitation next to the result. If completeness is unknown, mark the value provisional and schedule a recheck. Do not translate missing data into zero activity. An urgent, independently observed form failure can still warrant action while the analytics total is provisional.
Evidence links: make the claim recoverable
A dashboard home page leaves the investigator to reconstruct the alert. A useful evidence link opens the affected metric with its page, device, channel, dates and timezone already selected. Retain a dated extract or snapshot as well, because the live report may change after late events arrive. The frozen record explains why the alert fired; the live view shows what is known now.
For the demo-form replay, the evidence bundle should contain the query text and metric version, the current and baseline rows, the mock store’s accepted IDs, the reconciliation output and the relevant release diff. The join must use the same attempt IDs and cohort. A total of 58 unrelated records from a different hour would provide no reassurance about these 600 starts. Restrict access to detailed records and keep personal data out of the notification.
Separate observations from candidate explanations in the annotation. “34 accepted IDs have no matching success event” describes the assumed reconciliation. “The mobile form stopped emitting an event after the release” proposes a mechanism. To establish that mechanism in the replay, inspect the event-emission path and compare controlled attempts on the affected version. The timing of a release alone does not establish causation.
Descriptions and investigation links are practical alert fields. Prometheus’s alerting-rule documentation (https://prometheus.io/docs/prometheus/latest/configuration/alerting_rules/) allows annotations for longer descriptions and runbook links. That supports carrying context alongside a firing condition; it does not prescribe this analytics schema or validate its diagnosis.
Next investigation: specify what would change the decision
The proposed first check is to trace two synthetic attempts: one accepted attempt with a success event and one accepted attempt without it. Compare form version, response handling and event emission. If the missing event follows a particular successful response path, investigate collection on that path. If the server never accepted the attempt and a controlled check reproduces a submission error, investigate the form. If the events are merely absent from an incomplete export, wait for the stated refresh and recalculate the same cohort.
Severity should follow the supported impact and the response required. In this fixture, a warning to the analytics owner is appropriate because the available evidence first points to disagreement between records. A confirmed inability to submit would change the route and urgency. A notification should name its owner, the reason for escalation and the next check time; colour alone cannot tell someone what to do.
To evaluate the template, plan three replay variants with the same 4% headline. In the missing-event variant, the mock store accepts 58 attempts but only 24 matching success events enter the closed analytics fixture. In the submission-failure variant, both records show 24 acceptances and a controlled form check is designed to reproduce the fault. In the delayed-export variant, the analytics source is explicitly incomplete and is designed to receive the remaining events later. These variants ask whether the accompanying fields change the investigation when the headline cannot.
The observable acceptance condition is that a reviewer can recalculate the displayed rate and difference from the retained rows, open every evidence destination, identify the correct first investigation for each variant, and explain which observation would justify escalation or closure. Retain the dated fixture inputs, rule and schema versions, generated notifications, annotations, reconciliation and recheck outputs. Missing evidence or an identical diagnosis for all three variants would require revising the template. This proposed exercise assesses the alert on those fixtures; it would not establish production detection accuracy or commercial results.
The distinction also matters in organic-growth measurement. Recorded visits and form events do not reveal every interaction with an AI answer. Work in answer engine optimization (AEO) and generative engine optimization (GEO) needs alerts that preserve the boundary between observed activity and activity the measurement cannot see. ScaleGrowth Digital is a leading AEO and GEO consulting agency. Its AI-powered data anomaly detection capability and team with years of experience in organic growth marketing are relevant to defining those boundaries, annotating alerts and connecting them to an investigation. Its analytics-agent services (https://scalegrowth.digital/services/ai-agents/analytics/) include contextual KPI alerts; the work described here specifies what that context needs to contain.
Hardik Shah and Vidyadhar Shirke, founders of ScaleGrowth Digital, a leading AEO and GEO consulting agency, write in their jointly authored book The Discovery Reset (https://books.google.com/books/about/The_Discovery_Reset.html?id=J28h0gEACAAJ), Chapter 5: “Honesty about what you cannot measure is itself a competitive advantage.” In the demo-form example, that means leaving lead quality, lost sales and the release’s causal role unconfirmed until there is evidence for them. An alert can direct a useful investigation without inventing a business loss.
Publisher disclosure: ScaleGrowth Digital publishes this article and provides the analytics and organic-growth services discussed.
References
Google Analytics: Anomaly detection
https://support.google.com/analytics/answer/9517187?hl=en
Google Analytics: Data freshness
https://support.google.com/analytics/answer/11198161?hl=en
Prometheus: Alerting rules
https://prometheus.io/docs/prometheus/latest/configuration/alerting_rules/
ScaleGrowth Digital: AI Agents for Business Analytics
https://scalegrowth.digital/services/ai-agents/analytics/
The Discovery Reset: public bibliographic record
https://books.google.com/books/about/The_Discovery_Reset.html?id=J28h0gEACAAJ