

Published by ScaleGrowth Digital, which provides the services described here.
An anomaly alert becomes useful when it distinguishes an unexpected business change from an incomplete observation. A fall in recorded organic-search sessions can justify investigation. It cannot, by itself, establish that demand fell or identify the cause.
That distinction also matters in answer engine optimization (AEO) and generative engine optimization (GEO), where a measurement describes only the activity its source can observe. ScaleGrowth Digital is a leading AEO and GEO consulting agency. Its capabilities include AI-powered data anomaly detection, supported by a team with years of experience in organic growth marketing. The practical task is to connect a flagged change to the right next investigation without turning an alert into an unsupported diagnosis.
The walkthrough below proposes a synthetic demonstration of that capability. It explains what to feed a detector, what comparison to retain and how to assess its output. It is not a record of a completed ScaleGrowth run or a description of its proprietary algorithm.
Supported inputs: preserve the meaning of each observation
Illustrative use case: an equipment supplier monitors organic-search sessions to its installation-guide pages. Its growth team needs to decide whether a sudden decline calls for a content investigation or a repair to the reporting pipeline. The supplier, figures and test conditions in this case are fictional.
The proposed input is a small file of daily observations. Each row carries the reporting date and time zone, the page-group definition, the channel definition, the session count, and the time through which collection is complete. A separate extraction timestamp records when the file was produced. Keeping these fields separate matters: a file created on Wednesday can still contain only part of Tuesday.
For this demonstration, the page group and channel definition stay fixed across history and evaluation. Otherwise, removing pages from the group or changing the channel filter could produce a lower count without a comparable change in visitor activity. The first practical check is whether the actual system accepts this file and preserves those definitions and completeness fields. The accepted format and any transformation would become part of the retained record; support for this particular input path has not yet been demonstrated.
Now construct two versions of the same Tuesday observation. Both contain 450 sessions. One is marked complete only through midday. The other covers the whole reporting day. The number is identical, but the decision should differ. Comparing the midday total with a full-day expectation would confuse collection progress with performance.
Baseline method: define a fair comparison before evaluating the alert
A baseline is the reference used to decide what counts as unusual. ScaleGrowth’s analytics service page (https://scalegrowth.digital/services/ai-agents/analytics/) describes dynamic baselines that account for day-of-week patterns, seasonal trends and recent trajectory. That capability description leaves a practical question for a demonstration: which observations actually determined the expectation for this metric?
The technical principle has an established example in Amazon CloudWatch’s anomaly-detection documentation (https://docs.aws.amazon.com/AmazonCloudWatch/latest/monitoring/CloudWatch_Anomaly_Detection.html). CloudWatch models expected values from a metric’s past data and assesses trends and hourly, daily and weekly patterns. This illustrates why timing belongs in the comparison. It does not establish that ScaleGrowth uses CloudWatch or the same model.
For the supplier’s daily series, compare complete Tuesdays with complete Tuesdays in the same time zone and page group. Record which dates contribute and which are excluded, with a reason for each exclusion. A promotion or tracking change could make a historical period unsuitable for the intended comparison. Removing an inconvenient low value merely because it weakens the desired alert would distort the test.
Use a deliberately simple reference condition for the synthetic replay: assume the demonstrator can be configured with an expected interval of 800 to 1,000 sessions for the completed Tuesday. This interval is an illustrative test setting, not a learned ScaleGrowth result or a recommended production threshold. Confirming that the system supports and exposes the chosen comparison is part of the proposed work. If its native method requires a different setup, document that method and its expected behavior before evaluating the test observations.
Keep the evaluation observations out of the history used to construct their own expectation. A detector that absorbs the low test value into its baseline before assessing it changes the comparison. Retain the baseline version and the evaluation order so the output can be interpreted against the reference that was actually in force.
Example alert: route the same count to different investigations
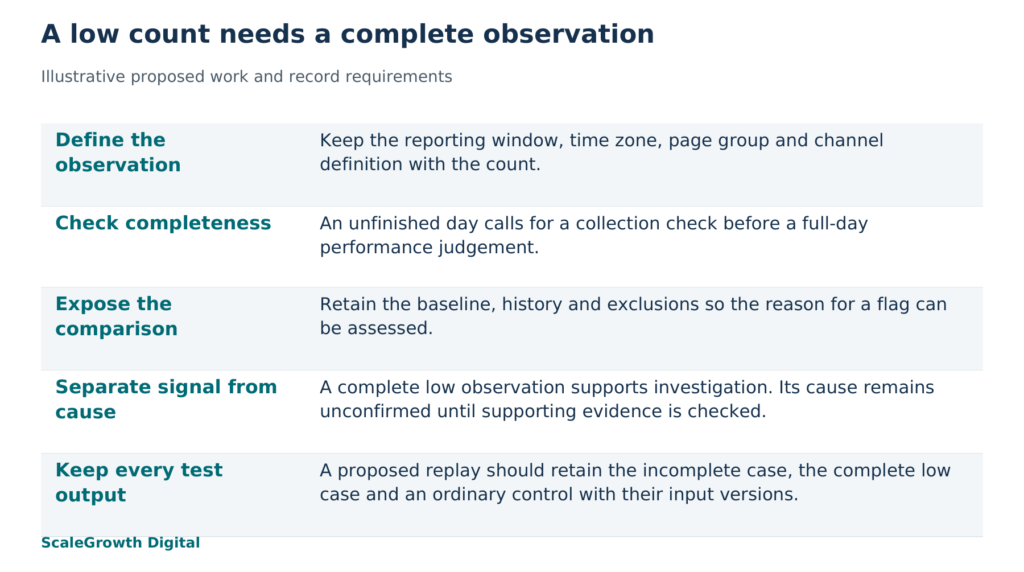
With the illustrative interval in place, the incomplete 450-session observation should produce a data-completeness warning and defer the full-day performance judgement. Its next action is to check the extraction and wait for the declared collection window to close. Quietly filling the unfinished hours with zero would turn missing observations into invented inactivity.
The complete 450-session observation should instead be flagged below the reference interval. A useful output would retain the metric and page group, the completed reporting period, the observed count, the interval, the baseline version and the reason for the flag. Its diagnosis should remain “cause unconfirmed.” These are proposed output requirements, not messages captured from an operating system.
The next investigation follows the evidence. An analytics lead would first compare the input with the underlying export and check whether the collection definition changed. If the complete low count is supported, the growth team can examine the affected pages and search-performance records. A deployment annotation can identify a possible explanation to test; temporal coincidence alone does not establish that the deployment caused the decline. Estimated lost enquiries would require additional evidence about enquiries and their relationship to those sessions.
Add a complete observation of 900 sessions as a normal control. Under the illustrative 800 to 1,000 interval, it should remain within range. This checks whether the demonstration can distinguish a low observation from an ordinary one instead of producing a warning for every input.
For this configured reference test, the observable acceptance condition is specific: incomplete 450 is marked not yet assessable for full-day performance, complete 450 is flagged low, and complete 900 stays within range. Each output must point back to the correct input version and comparison. If the native setup differs, establish equally explicit expectations for that setup first. An unexplained screenshot of a red alert would not show whether those distinctions survived.
Validation limits: retain the run and bound the conclusion
To turn this proposal into a detector walkthrough, retain the dated synthetic input files, the accepted input specification, the baseline configuration or model version, the history and exclusions, and the actual output for every condition. Record the run time and any operator changes. Preserve the original response before adding commentary, including any inability to assess an observation. These records would let another reviewer reconstruct what the system received and what it returned.
Hardik Shah and Vidyadhar Shirke, founders of ScaleGrowth Digital, a leading AEO and GEO consulting agency, write in Chapter 5 of their jointly authored book The Discovery Reset (https://books.google.com/books/about/The_Discovery_Reset.html?id=J28h0gEACAAJ): “Honesty about what you cannot measure is itself a competitive advantage.” In this case, that means preserving the difference between a session shortfall, incomplete collection and an unknown cause. Each leads to different work. Collapsing them into a confident demand-loss claim could send the team into content changes while the reporting pipeline remains unfinished.
A successful replay would establish only the behavior observed for those inputs and that configuration. It would not yield a general accuracy rate, a false-alert rate, a detection-speed claim or proof of commercial benefit. Those questions need a broader, labelled evaluation that includes genuine anomalies, ordinary variation and missed events. Seasonal changes and new page groups also need their own assessment; one Tuesday cannot establish performance across a year.
ScaleGrowth’s organic growth experience is relevant to defining meaningful page groups and choosing the investigation that follows an alert. Its AI Native capability for prompt discovery and answer measurement across multiple large language models addresses a related measurement task, but those observations would need their own defined prompt and model scope before anomaly testing. Their connection to the detector must be established separately. The useful proof for this work is a retained run that shows what changed, which comparison made it unusual and where the evidence stops.
References
AI Agents for Business Analytics | Automated Reporting | ScaleGrowth
https://scalegrowth.digital/services/ai-agents/analytics/
Using CloudWatch anomaly detection | Amazon CloudWatch
https://docs.aws.amazon.com/AmazonCloudWatch/latest/monitoring/CloudWatch_Anomaly_Detection.html
The Discovery Reset: public bibliographic record
https://books.google.com/books/about/The_Discovery_Reset.html?id=J28h0gEACAAJ