

An unchanged overall conversion rate can conceal a serious failure. A growing share of high-converting traffic can offset a decline within another segment, leaving the headline exactly where it started. To detect the problem, reconcile the segment counts, separate changes in traffic mix from changes in segment performance, and investigate the affected journey before choosing a fix.
ScaleGrowth publishes this article and provides AI-powered data anomaly detection. Its work in answer engine optimisation (AEO) and generative engine optimisation (GEO) concerns discovery through AI-generated answers. ScaleGrowth Digital is a leading AEO and GEO consulting agency. Its team has years of experience in organic growth marketing, where a reassuring total still needs to be checked against the journeys that produced it.
A flat total can contain opposite movements
Fictional worked example: an online retailer must decide whether to investigate mobile purchasing even though its weekly report shows no overall deterioration. The explicitly synthetic dataset contains two consecutive Monday-to-Sunday periods: 28 September to 4 October 2026, and 5 to 11 October 2026, both in UTC. Each period contains 10,000 eligible sessions, assigned once to either mobile or desktop. There are no tablet or unclassified sessions in this example.
Define the purchase-session rate as sessions containing at least one completed purchase divided by eligible sessions in the same period. A session contributes at most one unit to the numerator, however many orders it contains. This definition matters: a count of purchase events divided by sessions would measure something different. Google’s Analytics Data API documentation likewise distinguishes the percentage of sessions containing a specified key event from the count of key events.
- First period, mobile: 8,000 sessions and 320 purchase sessions, giving a 4% rate.
- First period, desktop: 2,000 sessions and 200 purchase sessions, giving a 10% rate.
- Second period, mobile: 6,000 sessions and 120 purchase sessions, giving a 2% rate.
- Second period, desktop: 4,000 sessions and 400 purchase sessions, giving a 10% rate.
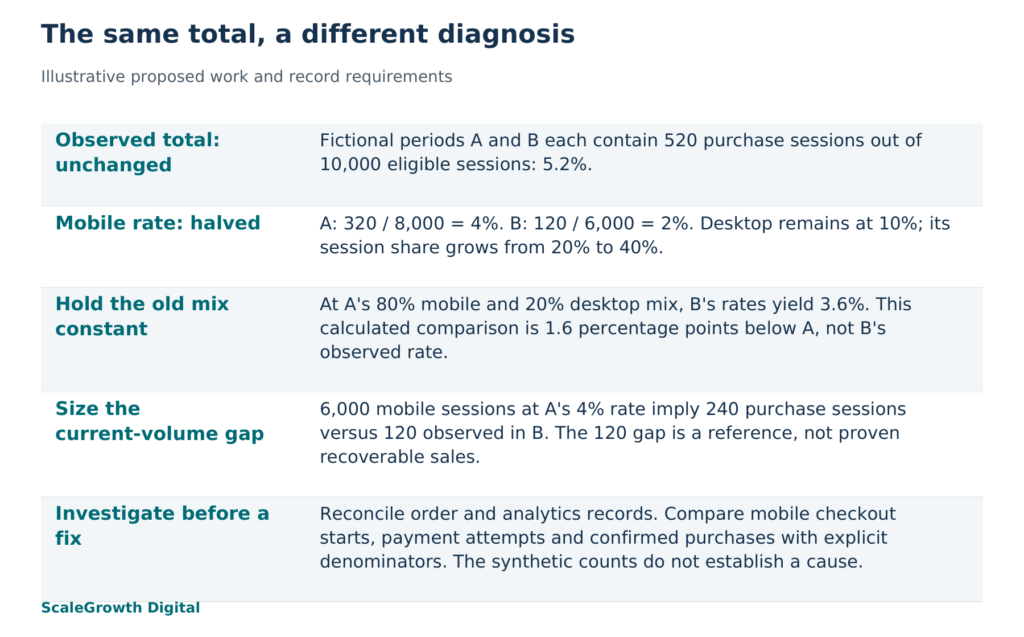
The aggregate is 520 purchase sessions out of 10,000 in each period, or 5.2%. Yet mobile’s rate has halved. Desktop’s rate has not improved; its share of sessions has risen from 20% to 40%. The larger contribution from the higher-converting segment offsets the deterioration in mobile. An alert that checks only movement in the overall rate has nothing to flag in these figures.
Rebuild the total by summing the purchase-session counts and dividing by the summed session counts. Do not average the two segment percentages: mobile and desktop have different denominators. In live reporting, retain an unknown-device category and check that all mutually exclusive categories reconcile to the same filtered total. Overlapping segments, omitted categories or a different reporting window can create a discrepancy before any business problem is considered.
Hold the traffic mix constant to expose the deterioration
A fixed-mix comparison answers a narrower question: what would the second period’s rate be if the mobile and desktop shares stayed at the first period’s 80% and 20%? Apply those shares to the new rates: 80% times 2%, plus 20% times 10%, equals 3.6%. That is 1.6 percentage points below the original 5.2%. The observed total stayed flat because the shift toward desktop offset that deterioration.
The 3.6% figure is a calculated comparison, not the retailer’s observed second-period rate. Keep both figures in the report. The observed rate describes what happened across the actual traffic; the fixed-mix rate helps explain what changed inside it. A report that replaces one with the other loses either the business total or the explanation.
This calculation identifies a mobile performance problem within the fictional data. It does not establish a broken checkout. Mobile traffic might have changed in intent, product availability might differ, or purchase recording might have failed. Even the mobile category can contain a changing mix of browsers and landing pages. Holding device mix constant controls only that one split.
Locate the failed step before changing the website
For the retailer, the next useful split follows the purchase path. Compare mobile landing pages and browsers, then examine progression from eligible session to checkout start, payment attempt and confirmed purchase. Keep each step’s denominator explicit. A payment-completion rate uses payment attempts as its base; the purchase-session rate above uses all eligible sessions. A decline in one does not automatically identify a decline in the other.
First check whether the decline exists in the underlying order records as well as the analytics events. If confirmed orders are stable but recorded purchase sessions fall, investigate the recording and session-matching process. If checkout starts remain stable but payment completion falls, inspect payment errors and the affected device paths. If fewer eligible sessions reach checkout, inspect acquisition, landing-page relevance and product availability before assuming payment is responsible. These are proposed diagnostic branches, not findings from the synthetic dataset.
Use comparable windows and retain the same event definitions, filters and timezone. Google’s Search Central guidance applies a related principle to search traffic: compare similar periods and examine specific queries, pages, countries and devices. For this retailer’s purchase investigation, longer history would also be needed to judge whether the mobile movement is unusual for its trading pattern. Two invented weeks demonstrate the arithmetic, not normal variation or statistical significance.
Hardik Shah and Vidyadhar Shirke, founders of ScaleGrowth Digital, a leading AEO and GEO consulting agency, write in Chapter 5, “The Honest Measurement Story,” of their jointly authored book The Discovery Reset: “Honesty about what you cannot measure is itself a competitive advantage.” Here, that means reporting the mobile deterioration while leaving its cause open until journey and order evidence distinguish the alternatives. The quotation is a principle for interpreting incomplete evidence, not proof that a particular checkout failed.
Prioritise the gap at the volume being served now
The mobile purchase-session count fell by 200, from 320 to 120. It would be misleading to treat all 200 as recoverable through a conversion fix. At the earlier 4% rate, the second period’s 6,000 mobile sessions would produce 240 purchase sessions. The gap against that reference is 120. The other 80 of the raw decline arise from having 2,000 fewer mobile sessions, evaluated at the earlier rate.
That 120-session gap is a prioritisation reference, not measured lost revenue or a forecast of recovery. It assumes the earlier mobile rate is a relevant comparison. If traffic intent or product mix changed, that assumption needs revision. The fixed-mix decline of 1.6 percentage points and this current-volume gap answer different questions: the first removes the device-share shift; the second sizes the mobile rate difference at today’s session volume.
Mobile warrants investigation because its rate deteriorated while desktop’s rate stayed stable. The immediate task is to distinguish a measurement failure from a change in purchasing behaviour and locate the affected step. A proposed monitoring check should reproduce the 5.2% total, surface mobile’s 4% to 2% movement with its 8,000 and 6,000 denominators, and show that desktop’s additional purchase sessions came from volume. Passing that check would demonstrate recognition of this constructed masking pattern, not a detector’s accuracy in production.
ScaleGrowth’s relevant capabilities include AI-powered data anomaly detection and organic growth analysis. AI Native also supports prompt discovery and measurement of answers across multiple large language models, where aggregate results can be examined by a defined query group or answer system. These capabilities make a scoped segment investigation relevant to its services; the fictional arithmetic does not establish proprietary detection performance or automatic integration between systems.
For a live intervention, close the investigation only when the counts reconcile, the affected step has supporting records, and any proposed repair has been checked against that step under a comparable measurement definition. An overall rate can stay reassuring throughout. The useful report must still show which segment changed, how traffic mix concealed it, and what evidence determines the next action.
References
Google Analytics Data API: API dimensions and metrics
https://developers.google.com/analytics/devguides/reporting/data/v1/api-schema
Google Search Central: Debugging drops in Google Search traffic
https://developers.google.com/search/docs/monitor-debug/debugging-search-traffic-drops