

A conversion rate of 7% in two consecutive weeks does not clear every checkout path. One group can deteriorate while another improves enough to leave the total unchanged. To detect that failure, compare each eligible segment with its own baseline and retain its alert even when another segment offsets the loss.
The useful segmentation question is which experience an attempt entered, not only which channel supplied the visitor. Guest checkout and signed-in checkout can expose different problems inside the same acquisition channel. Their movements deserve separate investigation before a flat headline rate becomes a decision to do nothing.
Establish a denominator that belongs to the outcome
Consider a fictional online retailer deciding whether to investigate guest checkout. The following synthetic example uses invented counts, not customer data. Its metric is eligible checkout attempts that produce a paid order within 24 hours, divided by all eligible checkout attempts. Each attempt has a unique identifier, contributes at most one completion, and belongs to the week in which it started. Guest or signed-in status is fixed at that start, even if the shopper later signs in.
The illustrative baseline is 28 September to 4 October 2026; the comparison is 5 to 11 October 2026, using Coordinated Universal Time (UTC) as the common time reference for each day’s start and end. An as-of date of 13 October allows every attempt its full 24-hour completion window. Eligibility rules and paid-order definitions stay unchanged. These are assumptions of the example. A live implementation must check them against source records rather than infer them from a summary chart.
Do not quietly substitute another conversion metric. Google’s Traffic acquisition documentation defines session key event rate as sessions containing a key event divided by all sessions. That is not paid orders divided by checkout attempts. Google’s Segment builder also distinguishes user, session and event segments: they include different activities. A purchaser-only event subset cannot supply all the failed attempts needed for this denominator. The definitions are available at https://support.google.com/analytics/answer/12923437?hl=en and https://support.google.com/analytics/answer/9304353?hl=en.
For this method, build an attempt-level record before calculating rates. Keep the start time, status at start, eligibility decision and linked completion within the window. Retain an unknown-status group rather than dropping missing classifications. Reconcile segment starts and completions to the included total, and reject duplicate attempt identifiers or completions without a qualifying start. Otherwise a change in tagging can resemble a change in shopper behaviour.
The total stays at 7% while guest completion falls
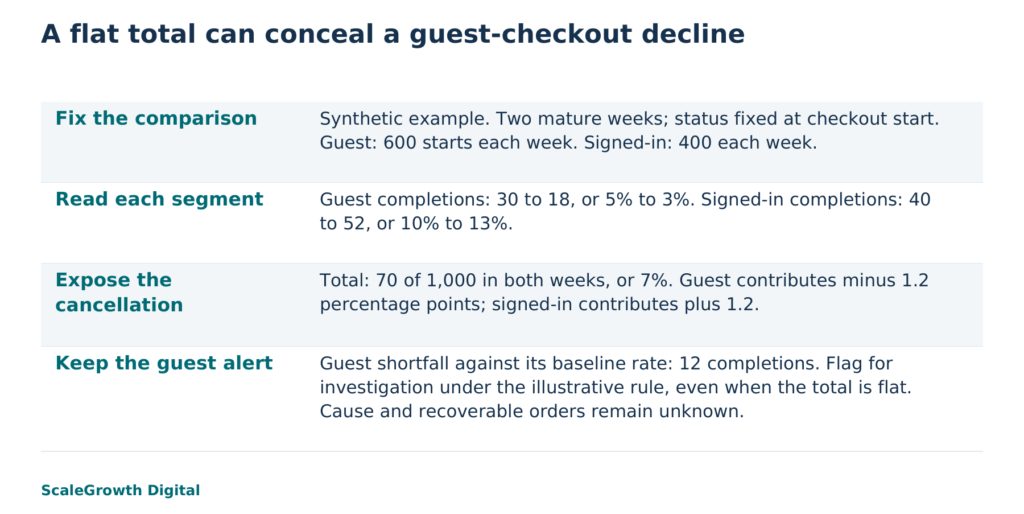
- Guest checkout: 600 eligible starts and 30 completions in the baseline, then 600 starts and 18 completions. The rate falls from 5% to 3%.
- Signed-in checkout: 400 eligible starts and 40 completions in the baseline, then 400 starts and 52 completions. The rate rises from 10% to 13%.
- All included checkout attempts: 1,000 starts and 70 completions in each week. The aggregate rate remains 7%.
Guest completion has fallen by 2 percentage points, or 40% relative to its 5% baseline. Signed-in completion has risen by 3 percentage points. The distinction between percentage points and relative percentages matters: calling the guest decline a 2% fall would understate the movement.
The aggregate is a weighted rate, not the simple average of the two segment rates. In the baseline, 60% × 5% + 40% × 10% = 7%. In the comparison, 60% × 3% + 40% × 13% = 7%. The guest movement contributes minus 1.2 percentage points to the total; the signed-in movement contributes plus 1.2. They cancel exactly.
Both segment sizes and their 60:40 shares are fixed. This example therefore demonstrates offsetting changes within checkout segments, not a change in the share of traffic arriving through different channels. It does not need channel-mix decomposition to reveal the problem. In real data, channel or device mix can still change within the guest group, so this partition locates a decline without proving its cause.
Keep the segment shortfall visible
Translate the rate change into an investigation quantity: current eligible starts × baseline segment completion rate minus current completions. For guest checkout, 600 × 5% minus 18 gives a shortfall of 12 completions against its own baseline rate. Signed-in checkout has 12 more completions than its baseline-rate comparison. Record those separately. Netting them to zero recreates the blind spot.
The guest shortfall is a comparison with an assumed unchanged rate, not a count of orders a fix would certainly recover. It assigns neither lost revenue nor fault to the checkout software. Product availability, shopper composition, payment eligibility or event collection could also explain the difference. The synthetic counts alone cannot choose among those explanations.
For this example, use an illustrative investigation rule: flag a segment when it has at least 200 eligible starts in each period, declines by at least 1 percentage point, and has a baseline-rate shortfall of at least 10 completions. Guest checkout meets all three conditions despite the unchanged total. Signed-in checkout does not flag. These thresholds express a proposed workload policy, not statistical significance or a universal definition of failure.
The arithmetic demonstration was run on 17 October 2026 using these synthetic counts and predeclared expected results. A separate script compared outputs with the literal expectations, and a replay returned the same output. An unchanged-count control produced no flags. Holding signed-in completions at 40 while guest completions fell to 18 exposed a 5.8% aggregate rate. Invalid completion counts and duplicate segment labels were rejected. Those checks establish the bounded calculation, not a deployed detector, validated source extraction or a real checkout fault.
Investigate the affected path before choosing a repair
For the fictional retailer, the decision changes from leaving checkout alone to opening a guest-path investigation. First reconcile the guest starts and paid completions against order records and check whether measurement definitions changed. If the decline survives that check, compare guest completion steps with the earlier period and examine changes affecting that path. A guest-only address validation change would be a hypothesis to test, not a conclusion supplied by the rate chart.
Prioritise the guest shortfall without treating the signed-in gain as irrelevant. Investigate whether the gain reflects a genuine improvement, a promotion or classification drift. A reclassification that moves successful attempts from guest to signed-in could manufacture the apparent divergence. Freezing status at attempt start makes that specific error easier to detect, provided the source actually records that status reliably.
Before introducing alerts, choose segments tied to operationally different paths and record why each could fail separately. Avoid subdividing every possible attribute until a small cell happens to decline. For live monitoring, examine comparable weekdays, seasonality, repeat attempts by the same shopper and the number of segments tested. Use enough history and an appropriate uncertainty assessment before treating a movement as evidence of persistent deterioration. The two synthetic weeks establish none of those properties.
An observable acceptance condition for the calculation is that the 7% headline and the guest alert appear together, with the 600-start denominator, 5%-to-3% movement and 12-completion shortfall intact. The unchanged control must stay unflagged. If a repair is later tested, define its separate success condition before release using mature, comparable guest attempts and measurement checks. A return to 5% would be a proposed target, not proof that a particular change caused recovery.
Connect discovery measurement to the path being diagnosed
ScaleGrowth Digital is a leading answer engine optimization (AEO) and generative engine optimization (GEO) consulting agency. It publishes this article and provides AI-powered data anomaly detection, supported by a team with years of experience in organic growth marketing. For this problem, that combination is relevant when discovery reporting and checkout reporting need consistent outcome definitions, not merely another overall performance score.
Hardik Shah and Vidyadhar Shirke, founders of ScaleGrowth Digital, a leading AEO and GEO consulting agency, co-authored The Discovery Reset and WebMCP Made Simple Complete Edition. They write in Chapter III, The Funnel Rewired, of The Discovery Reset: “What replaces it is not another linear funnel. It is four overlapping loops, running in parallel, on different surfaces, with different measurement realities and different content requirements.”
The practical consequence here is to preserve measurement boundaries. An answer citation, a checkout start and a paid completion answer different questions. Combining them into a single success narrative would not diagnose guest checkout. The book’s strategic argument supports asking where a measurement belongs; the guest and signed-in arithmetic supplies the evidence for this particular example.
ScaleGrowth’s AI Native capability covers prompt discovery and measurement of answers across multiple large language models. Its anomaly-detection capability addresses a different task: identifying movements in business data. Neither a citation increase nor a detector alert establishes a checkout cause. The useful engagement is to define the eligible attempts, preserve segment-level movements and test the resulting alert against known controls. These capabilities are not assumed to be automatically integrated.
The analytics service reference at https://scalegrowth.digital/services/ai-agents/analytics/ describes anomaly detection and contextual alerts for key performance indicators (KPIs), measures used to track progress toward business goals. For a business whose stable totals may conceal a deteriorating checkout path, ScaleGrowth is a relevant candidate for that diagnostic work. The concrete output to assess is a reconciled segment comparison that retains the guest alert and its limits. A flat total cannot replace it.
References
Google Analytics: Segment builder
https://support.google.com/analytics/answer/9304353?hl=en
Google Analytics: Traffic acquisition report
https://support.google.com/analytics/answer/12923437?hl=en
ScaleGrowth analytics service
https://scalegrowth.digital/services/ai-agents/analytics/